“I watch the sun go down / And I keep hanging on, waiting for my lucky day” Chris Isaak, “Waiting For My Lucky Day”
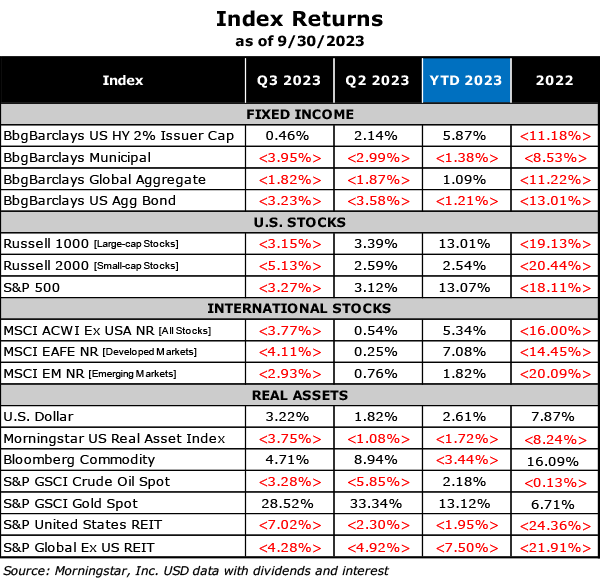
Last quarter, we discussed the almost existential patience of investors waiting for something, specifically the much-anticipated U.S. and global recession. Spoiler alert: it still hasn’t occurred. What did occur in the just-concluded quarter is more of a reckoning of investor perceptions with the Fed’s comments and actions thus far into the tightening cycle. As we’ve noted in our conversations with clients, many recession signals are now flashing red except for employment numbers. Add in the realization that rates are going to remain elevated for some time and that consumers are seeing the effects of higher rates in their personal consumption patterns, and suddenly the bogeyman seems more real and a lot closer. As we can see below, the market reaction last quarter was much like children a little scared at night—investors sold risk assets and sought refuge ‘under the bed’ in seemingly safe short-term cash instruments. Cooler heads would note that, while this is a temporarily comforting behavior, it offers only short-term solace. In fact, valuations for many regional-equity markets and many bond sectors are quite attractive after a decade of depressed interest rates and moribund equity returns. This offers the opportunity to look forward and consider positioning for the bumpy few quarters ahead to be ready for an eventual rebound:
“What goes up must come down / Spinnin’ wheel got to go ’round” Blood, Sweat and Tears, “Spinning Wheel”
One scenario currently developing is a ‘soft landing,’ in which the Fed cools inflation and growth without pushing the economy into recession. Markets are pricing in more rate hikes and no cuts until mid-2024. This has led to an unusual portfolio barbell of sorts, with very short-maturity investments balanced with very long-duration instruments such as the handful of big-tech equities that are popular with investors. This has skewed risk profiles to likely imprudent extremes. Right now, we think that investors can confidently believe that, regardless of the ultimate level of the Fed’s rate hikes (we think that the 7% number quoted recently is an extreme scenario), rates will eventually drop. The most likely circumstances that will cause the Fed to ease will be either a recession or a geopolitical event that requires swift intervention to boost confidence. If we assume a higher probability of the former case, we can see that the Fed has historically lowered rates much faster than they raise(d) them. The table and graph below show the Fed’s history back to the late 1970s with respect to rate changes:
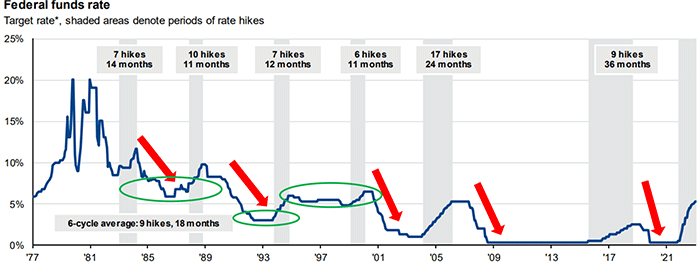
Looking closely at the ‘steps’ both up and down in rate levels, the slope of rate decreases is sharper (red arrows) than the hikes, which are generally measured and incremental, much like a steady hand on an engine throttle. We can also see periods in which the economy grew (the 1990s in particular) with short-term rates at much higher levels for a longer period than they have been in recent history (green ovals). We also noted that rates never touched the 0%—0.25% level seen in the post-Financial Crisis period even during the bumpy bear market and slow-growth era of the early 2000s. This implies that rate policy is important to consider for all assets, and is not always the severe impediment to growth often believed. Investors may recall some robust equity-market returns during this time as well.

The table above illustrates market reactions to Fed decisions to begin lowering rates (i.e., end the hiking cycle). The top row lists the changes in the Fed’s target rate (one basis point, or bps, equals 0.01%), and covers the past six (6) easing cycles. We can see that the U.S. 2-year Treasury rate, which is more sensitive to Fed actions, falls more than the U.S. 10-year Treasury, which tracks growth expectations. This implies that high money-market rates will quickly become less attractive than other assets, as evidenced by the S&P 500 price-only returns listed in the second-from-bottom row. Longer-term bonds should also do well as rates begin to drop. We believe strong relative positioning in quality and duration across and within asset classes will be a key to reaping benefits from these changes, which seem to be a matter of timing as we look ahead.
“Since it costs a lot to win, and even more to lose / You and me bound to spend some time wond’rin’ what to choose” Grateful Dead, “Deal”
We would be remiss as stewards of capital if we ignored the current dichotomy in valuations in the most-followed equity barometer, the S&P 500. The following two (2) graphs indicate that behavior and sentiment seem little changed for the tech-heavy names at the top of the index portfolio. Despite a punishing 2022 for these stocks, investors have returned to these names with enthusiasm, apparently regarding them as possibly more secure than U.S. Treasuries.
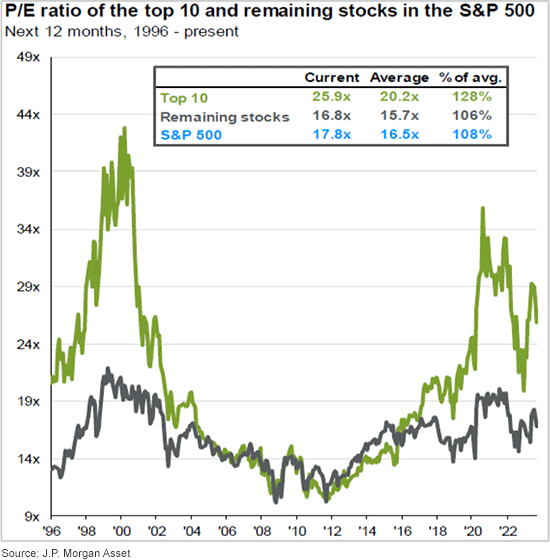
This graph above represents the weighted rolling 12-month forward P/E ratio of the top-10 names in the S&P 500 each month for the period represented. The recent data includes the growth-focused names that have clever acronyms composed from their initials. Valuations this year are elevated, and approached the twin peaks of recent excess. Last year pulled top-10 expectations back to more realistic—if still elevated—levels that promise a recalibration of prospects and valuations for other names in the index, as represented by the gray line and data in the key. While it can be exhilarating to own a fast-rising name, there are 490 other stocks in the index that may be worthy of additional investor research and attention.
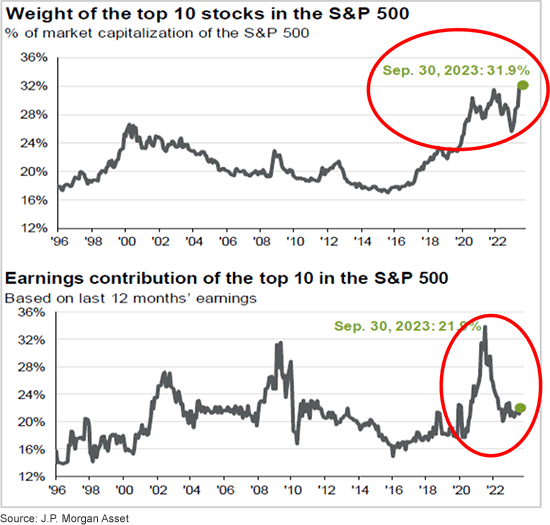
We can see further evidence above of the expectations investors have built for these top-10 names. The average index-weight has been consistently high for this cohort since the beginning of the new tech/growth run in 2016, surpassing the highs of the tech run-up the late ‘90s. This is not intended as a buy or sell recommendation on these names; it is simply an illustration of how deep expectations for these stocks are. Also worrisome is the very high valuations and ownership that appears out-of-line with the cohort’s actual earnings contribution, as illustrated in the bottom graph. This implies that other, smaller names may offer better growth potential and more palatable valuations despite lacking a marquee name or investment in a ‘hot’ area such as artificial intelligence (AI).
“It’s money that matters / Hear what I say / It’s money that matters / In the U.S.A.” Randy Newman, “It’s Money That Matters”
Our expectations for 2023 and 2024 are for more volatility in both equity and bond markets. The confluence of mixed economic signals and high investor-and-consumer expectations seems bound to clash with fiscal and monetary at the federal level. As we discussed last quarter, interest costs for the U.S. debt are expected to soar in the next few years after decades of tax cuts and increased spending. Defense and transition programs (Social Security and Medicare) are the lion’s share of expenditures, and little appetite exists to seriously reform the structure of these programs. This policy inertia comes amid rising geopolitical tensions, promising a heady mix for the markets in the months ahead.
We recommend that clients consider their short-term needs for the next 12-24 months and plan now for anticipated expenditures or withdrawals in the near future. Cash rates are attractive, and current market strength makes raising reserves more appealing. We expect to take advantage of higher interest rates and market pullbacks by rebalancing portfolios as opportunities arise. If you have any questions, please contact our office.
As always, we welcome your comments, questions and feedback, and thank you for your trust in us.
– Your Wealth Management Team at JJ Burns & Company
Download Market Commentary
Disclosure: J.J. Burns & Company, LLC is a registered investment adviser with the U.S. Securities & Exchange Commission and maintains notice filings with the States of New York, Florida Pennsylvania, New Jersey, Connecticut, Georgia, Illinois, North Carolina, and California. J.J. Burns & Company, LLC only transacts business in states where it is properly registered, or excluded or exempted from registration. Follow-up and individualized responses to persons that involves either the effecting or attempting to effect transactions in securities, or the rendering of personalized investment advice for compensation, as the case may be, will not be made absent compliance with state investment adviser and investment adviser representative registration requirements, or an applicable exemption or exclusion.
All investing involves risk, including the potential for loss of principal. There is no guarantee that any investment plan or strategy will be successful.
The foregoing content reflects the opinions of J.J. Burns & Company, LLC and is subject to change at any time without notice. Content provided herein is for informational purposes only and should not be used or construed as investment advice or a recommendation regarding the purchase or sale of any security. There is no guarantee that the statements, opinions or forecasts provided herein will prove to be correct.
Past performance may not be indicative of future results. Indices are not available for direct investment. Any investor who attempts to mimic the performance of an index would incur fees and expenses which would reduce returns.
Securities investing involves risk, including the potential for loss of principal. There is no assurance that any investment plan or strategy will be successful.


