“But February made me shiver / With every paper I’d deliver / Bad news on the doorstep / I couldn’t take one more step” Don McLean, “American Pie”
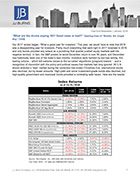
Investors have just lived through one of the worst quarters of performance across asset classes in quite some time. A volatile second quarter pushed global stocks near or into bear-market territory. Bonds had one of the worst starts to a year in four decades, and are likely in the fixed-income equivalent of a bear market. Difficult and unpopular policy decisions and general uneasiness have caused sentiment to turn pessimistic. The issues we discussed in our previous quarter’s letter—inflation, war in the West, a persistent pandemic, and geopolitical concerns—have ‘settled’ in the consciousness and show no signs of immediate resolution. We believe there is more under-the-surface turmoil in economies and politics than is currently being reflected in sentiment, as investors appear to be taking a ‘wait and see’ approach. We also see a willingness in the markets to take losses or exit positions and rotate to ‘safe-haven’ assets such as cash. While these actions might seem rational, they have an air of capitulation about them. That is both a good and bad sign.
The results below reflect market reactions to recent aggressive Fed actions that have pushed rates much higher than year-end levels and investors price-in their future expectations. All major sectors of the bond market were affected. Fears of a slow-down or the dreaded ‘r word’ (recession) hurt stocks as consumer and producer-price inflation, rising wages and eroding margins pushed stocks lower. Expectations tarnished the growth darlings of the past five years, as seemingly no sector or name was spared.
“And you may ask yourself / Well, how did I get here?” Talking Heads, “Once In A Lifetime”
A number of factors and policy decisions have brought investors to this market and economic nexus. The Federal Reserve and the federal government embarked on a series of programs to reflate equity-asset values (stocks and housing) after the Global Financial Crisis (GFC). A period of very-low interest rates (basically zero percent for the Fed Funds rate) and various bond-buying programs did indeed help boost equity and home prices. Further fiscal stimulus and Fed action during the COVID crisis led to an additional round of bond purchases and a reduction to a zero-percent Fed Funds rate.
This graph details the Fed’s two balance-sheet programs over the past 15 years. The first had several components and gradually pushed the Fed’s balance sheet north of $4 billion. We can see the gradual rolloff beginning in 2017 and the subsequent spike in 2020 as COVID hit. This caused the balance sheet to double very quickly. This tremendous support helped keep rates low and gave companies and consumers access to cheap capital.
This graph details the Fed’s rate-policy execution for the past two 22 years. The first Fed policy regime kept short-term rates at zero, which helped market psychology and asset reflation. A brief effort to begin a balance-sheet rolloff and raise rates ended in 2018 as growth fears rose and market turmoil ensued, andthe Fed quickly reacted. A zero-rate policy was again implemented in early 2020 to counter the economic effects of the pandemic.
The graph immediately above also reflects the Fed’s concerted efforts to achieve a ‘soft landing’ and combat high post-COVID inflation. Hindsight is a powerful explanatory tool, and it indicates the central bank may have been too sanguine in 2021 about the pace of inflation and their ability to bring it in line with their 2% average target. The Fed’s polices and the recovery from the Global Financial Crisis (GFC) had a double-barreled appreciation effect on equity assets, yet these same polices laid the groundwork for today’s market and policy turmoil. Cheap debt financing, the lifeblood of corporate growth and shareholder-wealth creation, was accessible to some companies and consumers who should have been more prudent with capital. It’s feasible to debate whether assistance should have been directly offered to individuals rather than corporations after the Global Financial Crisis and during the pandemic, but the ultimate wealth-effects on homes and stocks are clear.
This graph shows the trend in U.S. home prices as measured by the S&P/Case-Shiller Home Price Index, a popular measure of changes in housing values. The series runs from April 2008 (index value = 100) to May 2022. We can see the strong 2-stage recovery due to low rates, steady economic growth and rising equity-market values as a source of capital for home purchases. The recovery in this index is approximately coincident with the long bull market in the U.S. equity market after the GFC.
The next graph demonstrates the recent 25-plus years of S&P 500 history. We can see that this strong run after the GFC coincided with the accommodative Fed policies detailed above. The events of the Tech Bubble (Internet 1.0), the ‘Lost Decade’ from 2000-2010, and bull market beginning in early 2009 and the two pullbacks in 2018 and 2020 are all included. Also included is a summary table highlighting market valuations and yields at key points in the highlighted timeline. Of particular historical interest is the level on the U.S. 10-year Treasury, which was at 6.2% at the beginning of the Tech Wreck in March 2000. This is a much higher rate than at other inflection points detailed in the table.
“I got a little change in my pocket going jing-a-ling-a-tingles” The Georgia Satellites, “Keep Your Hands To Yourself”
Another important indicator of the success of the past 15 years of economic policy and activity is the growth in consumer balance sheets, as shown below.2 Total consumer assets of $168T are more than twice their pre- and post-GFC high and low values. We can also see the importance of residential real estate in household wealth (~ 25% of assets), as well as the importance of affordable mortgages that make up 66% of consumer liabilities. Clearly, higher rates will affect both sides of the balance sheet.
“Well now, listen people let me tell you some news / I’ll sing a song called the crude oil blues” Jerry Reed, “The Crude Oil Blues”
Inflation is the apparent no. 1 topic on the minds of investors around the globe. Following is a different look at some of the causes and sources of the high levels of inflation we’re seeing.
The left-hand graph details the excess savings generated by federal government policy actions and some Federal Reserve actions during and after the pandemic lockdown.2 The two largest blue bars indicate the spikes from legislation designed to put cash into the pockets of consumers to offset the various slowdowns and shutdowns during the early days of COVID-19. The results shown indicate the massive amounts of ‘surplus cash’ that was available to be spent on goods and services during and after the pandemic. Unsurprisingly, huge amounts of ‘new’ money in the system led to an increase in prices in many sectors of the economy. Supply-chain disruptions and shortfalls also contribute to rising inflation.
The right-hand graph details the intermediate-term trends for U.S. real spending on goods and services before, during and post-pandemic.2 The blue line representing goods spending reflects the pandemic-related shift away from services (curtailed or unavailable, e.g., dining out) to goods. The red line reflects how services spending declined and has yet to recover, but the net trends are higher and indicate increased consumer demand that coincides the increased amount of money supply detailed in the left graph. It appears evident that the causes and effects of the recent increase in inflation are multi-layered and will not be correcting overnight.
“Feelings, nothing more than feelings” Morris Albert, “Feelings”
The investing mood driving markets and spurring talk of a recession leads us to examine the role sentiment plays in behavior and investment decisions. Recessions are defined by the National Bureau of Economic Research and are determined after they’ve begun and (usually) ended. The NBER definition of a recession is, broadly, “a significant decline in economic activity spread across the economy, lasting more than a few months.”1 Although declining GDP is coincident with recessions, it is not the only measure the NBER reviews. GDP is also not a monthly statistic, whereas other indicators such as retail sales, employment data and industrial production are updated more frequently and may offer better signals. Changes in this data dictate market sentiment and behavior in a ‘chicken or the egg’ scenario. One important observation we’ve made over the years is that fear and doubt are ‘snowball’ emotions, and they tend to grow larger in our collective consciousness as they become reinforced. This does not mean that financial data and important events should be ignored; rather, they should be evaluated in a broader portfolio context while considering that markets periodically fall and re-value. Making smart decisions as conditions change in anxious times is a key to long-term success.
This graph charts the difference between two data series from the Conference Board, one reflecting how consumers currently feel and the other reflecting their expectations six (6) months into the future. The gray areas are recessions. We can see that as markets and the economy perform well (the periods between recessions), negative sentiments tend to overcome positive thinking about current circumstances. Maximum pessimism (negative scale) appears to unsurprisingly peak at the time of recessions, but optimism (positive scale) quickly and dramatically begins to recover as circumstances are perceived to be improving.
The next graph details 12-month returns for the S&P 500 after peaks and troughs in the University of Michigan’s consumer-sentiment survey. It demonstrates that the average return following a sentiment trough is six times greater than the average return following a peak. (Removing the datapoint for Feb. 2020, which includes a strong rebound from the pandemic lockdown, drops the average peak return to near zero.) A recent data measurement has reached a 50-year low, which implies that forward 12-month returns will be positive and greater than 10%. We would be very cautious about casually making this assumption at this point given the unusual market environment due to the pandemic and years of very low interest rates, but we can see the powerful link between emotions and actions and how quickly sentiment can change and influence behavior.
“Hope for the future / It’s coming soon enough” Paul McCartney, “Hope for the Future”
We conclude with the following table that highlights our thinking on issues and events that are driving the markets and the global economy right now. As we described earlier, the unusual policies and events of the past 15 years or so make prognostication—already a vexing exercise—more difficult than normal. We would like to believe that the war in Ukraine will end peacefully, that everyone will have a job at a good wage and a healthy work-life balance, that global food-insecurity eases, that COVID is finally vanquished…but these things won’t happen overnight and certainly not without much compromise.
We remain long-term optimists while acknowledging that, periodically, current conditions present difficult challenges. Our strategies in this market, which has revealed few places to hide in publicly-traded securities, has led us to execute on these actions:
- Realizing tax losses where prudent in expectation of a market rebound.
- Rotating into a market segment that may hold value in the face of more turmoil and downside broad-market performance.
- Raising cash for clients who take regular withdrawals to avoid selling at market lows.
We believe these are prudent actions to take in this environment and will sow the seeds for further productive activity such as rebalancing
Thank you for your confidence in us and as always, please contact us with your comments and questions.
—Your Wealth Management Team at JJ Burns & Company
1 “Business Cycle Dating Procedure: Frequently Asked Questions: The Great Inflation,” n.d., https://www.nber.org/business-cycle-dating-procedure-frequently-asked-questions (accessed 7/29/2022)
2 Source: J.P. Morgan Asset Management
Disclosure: J.J. Burns & Company, LLC is a registered investment adviser with the U.S. Securities & Exchange Commission and maintains notice filings with the States of New York, Florida Pennsylvania, New Jersey, Connecticut, Georgia, Illinois, North Carolina, and California. J.J. Burns & Company, LLC only transacts business in states where it is properly registered, or excluded or exempted from registration. Follow-up and individualized responses to persons that involves either the effecting or attempting to effect transactions in securities, or the rendering of personalized investment advice for compensation, as the case may be, will not be made absent compliance with state investment adviser and investment adviser representative registration requirements, or an applicable exemption or exclusion.
All investing involves risk, including the potential for loss of principal. There is no guarantee that any investment plan or strategy will be successful.
The foregoing content reflects the opinions of J.J. Burns & Company, LLC and is subject to change at any time without notice. Content provided herein is for informational purposes only and should not be used or construed as investment advice or a recommendation regarding the purchase or sale of any security. There is no guarantee that the statements, opinions or forecasts provided herein will prove to be correct.
Past performance may not be indicative of future results. Indices are not available for direct investment. Any investor who attempts to mimic the performance of an index would incur fees and expenses which would reduce returns.
Securities investing involves risk, including the potential for loss of principal. There is no assurance that any investment plan or strategy will be successful.