“What a long, strange trip it’s been” Truckin, The Grateful Dead
Noted hippie-rockers The Grateful Dead recently celebrated their 50th anniversary with a series of five farewell concerts performed by the four surviving members and guest artists. Estimated profits from ticket sales, merchandise and other sources are expected to top $55 million. Not bad for a band that started during the heyday of the ‘60s upheavals and rarely reached the top of the album or singles charts. So, as we say farewell to the Dead, we look to their music for inspiration for our quarterly review.
We’re in the sixth year of our recovery from the great Financial Crisis. It has indeed been a ‘long, strange trip.’ The U.S. has had the best recovery, Europe the worst, and other developed and emerging markets somewhere in between. Current consensus is that global growth and markets are now aligned and should move higher. There’s something to be said for consensus, and that is, it’s usually wrong. As we can see from the first half of the year and the second quarter in particular, nobody seems to agree about anything:

With the exception of commodities, the second quarter was disappointing but, at the same time, in line with rational expectations. Big moves in the second half of 2014 and the 1st quarter for oil, the U.S. dollar, Euro bonds and some equities led to some technical anomalies. As a result, some overbought and oversold positions normalized. For example, German 10-year bonds ranged in yields from a low of 0.05% to 1.00% during the quarter. That’s a big move, but analysts concur that it was driven by technical developments, not fundamental. The U.S. dollar and oil also had some technical reversal as well, as positons may have been oversold in the case of oil and overbought in the case of the dollar.
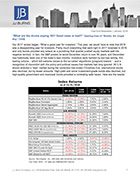
We’ve all heard the term ‘sideways market.’ It’s used to describe a volatile stretch when there seems to be a lot of price movement but no clear leadership in any one area among or within asset classes. The first six months of 2015 are an excellent example of what this looks like:

The table demonstrates the indecision in the markets, and the volatility associated with news that is sometimes divorced from underlying fundamentals. Reviewing the ranks of the index returns listed above, investors trying to time the markets were whipsawed in virtually every area. U.S. REITs, commodities and U.S. larger-cap stocks were particularly volatile. They ended June slightly positive (stocks) or negative for the year to-date (commodities and REITs). Aside from small/mid-cap and non-U.S. stocks and U.S. high-yield corporate bonds, it’s been a moribund and disappointing start to the year.
“Since it cost a lot to win / and even more to lose / You and me bound to spend some time / wondering what to choose” Deal
Despite the troubles in Greece and the European Monetary Union (written about in our blog), and in China due to its attempts to engineer an economic restructuring and slowdown, we think markets should continue on course. Data we review points to continued progress for the U.S. economy as well as some other developed markets due to European quantitative easing. Yes, the FOMC will likely raise rates and the U.S. dollar may strengthen, but the Fed is not applying brakes to the economy because it is overheating. Higher short-term rates are necessary so the Fed will have some room to stimulate the U.S. economy when the next recession occurs; right now, that event isn’t on the horizon.
Something we are watching is the growing spread between growth and value returns. Generally, the later stages of bull markets demonstrate that investors favor growth stocks over value stocks. These Morningstar graphs chart the rolling 3-month returns of U.S. large-cap (top graph) and small-cap stocks (lower graph) from January 2012 to June 2015. The spreads show a shift to growth stocks (red and green lines) which may indicate that the U.S. is moving to the late stage. This DOESN’T mean that stocks will crater; it simply means that some areas of the market are pricey, and earnings and revenue results will be closely scrutinized going forward.


“I may be going to hell in a bucket, babe / But at least I’m enjoying the ride” Hell in a Bucket
While the market returns the first half of the year have been lackluster, our outlook remains unchanged. We believe the Fed will raise rates, stocks in many areas will be generally up, growth will be positive and global interest rates will fluctuate. Given the search for equilibrium in many markets and investor demand for elusive ‘clarity,’ we also expect volatility to increase. We will carefully monitor our strategic allocations and managers and look for attractive thematic ideas to incorporate into portfolios. Once the geopolitical noise has subsided, we expect the market will return to trading on the fundamentals of corporate earnings and prospects of future economic growth.
As always, we welcome your comments, questions and feedback.
-Your Wealth Management Team at JJ Burns & Company
Disclosure: J.J. Burns & Company, LLC is a registered investment adviser with the U.S. Securities & Exchange Commission and maintains notice filings with the States of New York, Florida, Pennsylvania, New Jersey, Connecticut, and California. J.J. Burns & Company, LLC only transacts business in states where it is properly registered, or excluded or exempted from registration. Follow-up and individualized responses to persons that involves either the effecting or attempting to effect transactions in securities, or the rendering of personalized investment advice for compensation, as the case may be, will not be made absent compliance with state investment adviser and investment adviser representative registration requirements, or an applicable exemption or exclusion.
Unless otherwise stated, performance numbers refer to indexes, which cannot be invested in directly and have no fees or trading expenses associated with them. All index data provided by Morningstar, Inc.
Russell data © Russell Investment Group 1995–2015, all rights reserved. Dow Jones data provided by Dow Jones Indexes. MSCI data © MSCI 2015, all rights reserved. S&P data provided by Standard & Poor’s Index Services Group. © 2015 Merrill Lynch, Pierce, Fenner & Smith Inc.; all rights reserved. Citigroup bond indices © 2015 by Citigroup. Barclays data provided by Barclays Bank PLC. Indices are not available for direct investment; their performance does not reflect the expenses associated with the management of an actual portfolio.
Past performance is no guarantee of future results. This information is provided for educational purposes only and should not be considered investment advice or a solicitation to buy or sell securities.
Investing risks include loss of principal and fluctuating value. Small cap securities are subject to greater volatility than those in other asset categories. International investing involves special risks such as currency fluctuation and political instability. Investing in emerging markets may accentuate these risks. Sector-specific investments can also increase these risks.
Fixed income securities are subject to increased loss of principal during periods of rising interest rates. Fixed-income investments are subject to various other risks, including changes in credit quality, liquidity, prepayments, and other factors. REIT risks include changes in real estate values and property taxes, interest rates, cash flow of underlying real estate assets, supply and demand, and the management skill and creditworthiness of the issuer.
The Russell 1000 Index measures the performance of the large-cap segment of the U.S. equity universe. It includes approximately 1000 of the largest securities based on a combination of their market cap and current index membership. The Russell 2500 Index measures the performance of the small-cap segment of the U.S. equity universe. It includes approximately 2500 of the smallest securities based on a combination of their market cap and current index membership.
The Barclays U.S. Corporate High-Yield Index covers the USD-denominated, non-investment grade, fixed-rate, taxable corporate bond market. The Barclays U.S. Aggregate Index covers the USD-denominated, investment-grade, fixed-rate, taxable bond market of SEC-registered securities.
The Citi World Government Bond Index (WGBI) provides a broad benchmark for the global sovereign fixed income market. It measures the performance of fixed-rate, local currency, investment grade sovereign bonds, currently includes sovereign debt from over 20 countries denominated in a variety of currencies.
The Morningstar® US Real Asset Index is a diversified portfolio of four different asset classes that have historically displayed high sensitivity to inflation. Real assets are defined as TIPS, commodity futures-based strategies, real estate investment trusts, and inflation-sensitive equities such as upstream commodity stocks and master limited partnerships
The S&P U.S. REIT Index defines and measures the investable universe of publicly traded real estate investment trusts domiciled in the United States. The S&P Global REIT index is a comprehensive benchmark of publicly traded equity REITs listed in both developed and emerging markets. The S&P 500® index includes 500 leading companies and captures approximately 80% coverage of available market capitalization.
The MSCI ACWI index captures large and mid-cap representation across 23 Developed Markets (DM) and 23 Emerging Markets (EM) countries. The MSCI EAFE Index is an equity index which captures large and mid-cap representation across Developed Markets countries around the world, excluding the US and Canada. The MSCI Emerging Markets Index captures large and mid-cap representation across 23 Emerging Markets (EM) countries.
The Bloomberg Commodity Total Return index is composed of futures contracts and reflects the returns on a fully collateralized investment in the BCOM. The index currently represents 20 commodities, which are weighted to account for economic significance and market liquidity.
Disclosure: J.J. Burns & Company, LLC is a registered investment adviser with the U.S. Securities & Exchange Commission and maintains notice filings with the States of New York, Florida Pennsylvania, New Jersey, Connecticut, Georgia, Illinois, North Carolina, and California. J.J. Burns & Company, LLC only transacts business in states where it is properly registered, or excluded or exempted from registration. Follow-up and individualized responses to persons that involves either the effecting or attempting to effect transactions in securities, or the rendering of personalized investment advice for compensation, as the case may be, will not be made absent compliance with state investment adviser and investment adviser representative registration requirements, or an applicable exemption or exclusion.
All investing involves risk, including the potential for loss of principal. There is no guarantee that any investment plan or strategy will be successful.
The foregoing content reflects the opinions of J.J. Burns & Company, LLC and is subject to change at any time without notice. Content provided herein is for informational purposes only and should not be used or construed as investment advice or a recommendation regarding the purchase or sale of any security. There is no guarantee that the statements, opinions or forecasts provided herein will prove to be correct.
Past performance may not be indicative of future results. Indices are not available for direct investment. Any investor who attempts to mimic the performance of an index would incur fees and expenses which would reduce returns.
Securities investing involves risk, including the potential for loss of principal. There is no assurance that any investment plan or strategy will be successful.