We recently attended the “National IMPACT Investment Advisors Conference”. Many investment advisors, portfolio managers and financial forecasters from around the world were in attendance. A few of my sessions covered the state of the global economies. Valuations on stocks, values in bonds, and the hopes of recovery globally were the underlying themes. It was interesting to hear economists, managers, analysts, and even the average investor discuss these issues.
The current environment may be a bit confusing when listening to the media. Therefore, I analyzed both sides of the “fence” and am sharing my personal notes, which form the basis of the “pessimistic and optimistic” analysis. We think its important to share with you this information so as to better explain our asset preservation minded portfolio allocation:
The Pessimistic Analysis: Why The Economy/Market Will Not Get Better:
- The mothers milk of the economy, CREDIT is not readily available as it was prior to this crisis
- Debt levels are very high at the state(public level) and private sector
- The banking sector is healing with stimulus but Government completely back stops what used to be the Shadow banking system
- Budget deficits on all levels are stratospheric
- Real estate is not going down as much and perhaps could be bottoming, but commercial real estate has yet to hit bottom.
- Foreclosures have yet to be taken in by banks and balance sheets will likely worsen, commercial mortgages could be double whammy!
- The unemployment rate is high and underemployment rates are marching even higher. The true figure is higher as unemployed worker soon to go off data charts
- Consumers are burdened with debt and will take a long time to deleverage as refinance options are underwater
- Deflation is still a big threat and inflation could be around the corner
- Weak US dollar and it could go a lot lower
The Optimistic View: Why the Economy Will Get Better and the Stock Rally is Just Starting:
- Credit markets are improving and the worst has been avoided
- Stocks are rising and showing signs of bottoming
- Low inventories, slowing losses in jobs could signal a bounce back
- Housing has bottomed
- Emerging markets economies have recovered and are driving production
- Worldwide Global Stimulus: All countries are communicating to get growth back on track
- Stimulus is working as consumers are taking advantage of incentives
- US export growth up
- Banks are lending
- Low interest rate economy (likely to remain low) can only signal signs for growth
- Easing credit standards lead consumer spending
- GDP can still advance even without trade, housing, autos
- A steep yield curve in the bond markets tends to signal expansion
- Some corporations are showing bounce in profits (albeit from a revised lower estimate)
- Inflation (for the time being) is low
- Its easy to have a pessimistic view
I have reviewed the above data with many of our own analysts as well as others who differ with our current view of the investment environment. The problem with some of the points is they cannot be supported with concise data. Ultimately, when the “average person” sees the stock market rise then they may assume things are getting a lot better. We think it is important to back up any analysis with data and facts to support those conclusions. Below is our analysis which ultimately leads to our theme of managing a portfolio to seek first, asset preservation in this current environment. Certainly growth is important as indicated above, but when one looks at your time horizon, risk, and potential needs for income, asset preservation certainly becomes the dominant theme to investment management in many portfolios.
Housing and the Real Estate Market:
Many analyses we read and listen to are dependent on the premise of an improving housing market. This you may say is the main ingredient to the more optimistic forecast. In other words, economic forecasting models are adjusted to accommodate a better US housing market. Almost any data received in the market place has a positive spin. Let’s examine this data as it was just released in the recent Case- Shiller report (updated national data on housing):
Lately, the home price data continue to show some improvement. A 1.6% gain in July, from a 1.4% gain in June and +.05% gain in May. We now have a 3 month trend running at a +15% annual rate. Remember we just had an April that this same trend was deep in negative territory, at -18%. The reality is that this level is down 13.3% from a year ago. The numbers we receive are from July in this housing data amid the “stimulus” the government has provided for first time home buyers. In August, the average resale home price fell 2.0% both on an average and median basis in their worst showing since January, and median new home prices collapsed 9.5% month over month and on average fell 6%. On average as reported by homebuilders it is taking 13 months to make a sale upon completion of a new home. The home supply data is completely distorted because all of the inventory that has been held off the real estate market on bank balance sheets, will come to the market. The estimates we have seen show inventory at 7 million housing units. These are homes in foreclosure, those just entering the process, and those that have been in arrears for the past year but have yet to receive a notice of foreclosure. If you add this figure onto the already 3.6 million homes in inventory you have more than 25 months of housing supply on the market. Finally, rental prices are dropping making renting a lot cheaper then owning. With this kind of headwind and with the temporary Government stimulus (significant and unprecedented) it’s hard to believe that housing is all better or even on an upward trend. We don’t see stabilization. Furthermore, even the pundits will say, “stabilization does not mean that an upward trend is taking place”. Yet, other Wall Street pundits want so much to believe in this.
Case Shiller Home Price Index: Oct. 2003 – July 2009

Most Home Sales Are Due to Foreclosures
I had the opportunity to meet with one of the larger private lenders from Southern California. His own thoughts and data confirm that home sales are attributable to foreclosures. He indicated that any homes selling are at fire sale prices and many have taken advantage of the federal tax credit for first-time home buyers. 40% of the homes sold in the area accounted as foreclosure sales. Additionally, banks have yet to unleash the inventory yet to be foreclosed upon. Many who remain unemployed (more layoffs at the State level to come) are moving and sending in their “jingle mail” (walking away from their homes and mailing the keys to the lender). Many homes are valued far less than their mortgage outstanding.
Consumer Credit Contraction
As I indicated in my last newsletter commentary (2q 2009) the consumer continues to deleverage their debt outstanding. Last weeks news was a massive $12 billion decline in outstanding consumer debt since August. Expectations were for $8 billion. Had it not been for the “cash for clunkers” program the debt reduction would have been higher.
Consumer Credit Outstanding US:
year over year difference in billions

I was recently reminded by Dave Rosenberg that,” if the household debt/income ratio were to ever revert back to 1983 levels, which is exactly where the employment/population ratio has fallen to, we would be taking off at least another $5 trillion of deleveraging left in the pipeline as far as the consumer is concerned. This is going to prove to be a very lengthy process.”
Bank Lending:
The monetary base is up significantly (some 50% at an annual rate) over the last two months. Bank lending has plunged in the private sector by at least $40 billion and continues to decline. This is showing up in banks unwillingness to lend in the commercial loan market too. Commercial real estate has yet to see a noted significant fall but this is clearly straight ahead of us. This theory is supported by just following the money trail, banks are not lending they are putting their money into US Government bonds. Banks are putting billions of dollars to work in the government bond market, purchasing over $20 billion of Treasuries and Agencies (bonds) in the September month alone. It’s important to look at this as the yield curve (short term and long term interest rates on a graphically represented curve which is aka “yield curve”) represents this data to us as an indicator. In studying the yields and action in the bond markets, (a widely accepted indicator) the US Economy is seen more as deflationary.
What Are Bonds Telling Us?
Yields have fallen across the board and certainly on the 10 year Treasury note. What bonds are telling us again and again is that we live in a deflationary world. Prices are declining at a rapid pace. Even rents on apartments are coming down. We can track data back to the early 1980’s recession for some level of comparisons. Retail stores are going out of business (actually over 8,000 stores have gone out of business – needless to say about the glut of commercial space to hit the market) and competitors are slashing prices. Even Neiman Marcus stores are giving out $50 gift cards – free, to be utilized in their stores. There is simply no pricing power at the retail level. Company profits have stabilized to some extent but only on the slashing of labor – jobs and cutting of costs. Yet, the stock market maintains a valuation of $80 of operating earnings which is double the current quarterly pace. The only way the stock market can maintain this valuation is if companies can raise their prices. We simply don’t see this occurring.
Employment:
A recently released report indicated that jobs in temp agencies employment (this is widely considered to be a good indicator) declined by 2,000. However, there is no other way to understand the recent employment report just out. The deterioration in employment was expected to be -175,000 and instead came in at -216,000 nonfarm payrolls. Looking at the big picture, the employment slide is over 1.2 million jobs in two months. Digging deeper into this report the deterioration was across the board and significant. We now stand at 9.8% unemployment. New hiring is virtually non-existent, especially in the small business sector which accounts for half of the job creation in America. This trend will likely persist.
Small Business Index of Expected Hiring:
Oct. 2003 – Sept 2009

Consumer Confidence:
During an economic expansion, the consumer confidence reading averages 102. When a recession ends, the consumer confidence index averages 72. Historically, by the time the S&P 500 rebounds 60% as it recently has from the lows, the confidence index is sitting at 92. Consumer confidence numbers recently surprised to the downside as it fell to 53 from 54. Optimists will remind us that the market is pricing in mid-cycle earnings, which means we can look three years out. If this was true we would be at a confidence reading around the mid 80’s. I wonder what confidence would be over the last few months had stocks not mounted a rally?
Consumer Confidence Oct. 2003 – Sept. 2009

Equity Market Valuation*:
The S&P 500 is trading north of a 26x P/E multiple on trailing operating earnings and history shows that at these high valuation levels, the market declines in the coming year 60% of the time. All we know is that we have a trailing P/E multiple (operating earnings) on the S&P 500 of 26.5x — a record eight multiple point expansion from the low over a six-month span. Take note that this is the highest P/E multiple since March 2002, which is right around the time that the bear market rally at that time (also premised on post-crisis V-shaped recovery hopes) began to roll over. It took a good year for the fundamental bottom in the market to be put in, and that was heresay back then too. The P/E multiple on non-scrubbed reported earnings has soared 60 points since March to 184x — not only a record but five times more expensive than what we saw during the peak of the dotcom bubble a decade ago (oh, but we forgot — write-downs don’t matter). Going back over the last six decades, we know that the market typically faces serious valuation constraints once it breaches the 25x P/E multiple threshold. The average total return a year out for the S&P 500 is -0.3% and the median is -6.2%. The total return is negative a year later 60% of the time, so when we say that there is too much growth and too much risk embedded in the equity market right now, we like to think that we have history on our side. As for valuation, the S&P 500 is now priced for $83 in operating EPS (we come to that conclusion by backing out the earnings yield that would match the current inflation-adjusted Baa rated corporate bond yield). That is nearly double from the most recent four-quarter trend.
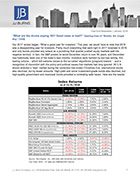
What Should The Economy Look Like After A 60% Stock Market Rally?
- GDP has expanded by 5.3%, on average (now just bottoming out)
- Corporate profits are growing at 34%, on average (still bottoming out)
- Employment has rebounded by 2.1 mln (still declining)
- Bank lending rose an average of 16.5% (continues to decline)
- ISM is at 58.9, on average (now 52.9)
- Consumer Confidence (Conference Board) is at 91.8, on average (now 54.1)
The bond market spreads (difference in yields between bonds) are still high. This is due to an economy which has been damaged. For example, an investment grade corporate bond compared to a US Treasury may yield ½ or 1% more than the government bond of its same maturity in a more “normal” time. Today these same differences or spreads may be 2% – 3% more. In the high yield arena, some 7-8% spreads! As the economy heals the yields will likely contract and spreads will narrow , while collecting a coupon for income. We see that equities have 4% GDP (Gross Domestic Product) growth being discounted ahead. This does not mean to depart equities entirely, as there are defensive issues and consumer staples which will offer conservative equity exposure. It may take time to reveal that anemic growth will be happening at best. The biggest risk investors are facing now is extrapolating the past trend into the future. As a quick side note: Recently, earnings came out from Costco, Monsanto, and Family Dollar Stores. Interesting, in that they all beat earnings expectations, yet there is weakness in stock prices. Drilling down into the data reveals that sales are continuing a downtrend and the main reason these companies beat is because of cost cutting. Consumers are purchasing food and staples and in some cases buying a bit more, but sales continue to trend down. As the Q3 earnings season is upon us, what investors will be looking for in particular are signs that companies are boosting revenue growth and raising future guidance at the same time. Currently, we don’t see these signs.
Final Analysis:
The final analysis is that the economy still looks uneasy at best. Policy makers are thinking more on behalf of their respective parties than in a non-partisan way. The economy is still on an infused government stimulus plan and remains on life support. Perhaps we have avoided the very worst fear of “Financial Armageddon”, however, this may not be a time to assume a new growth period. With these challenges come many opportunities. We believe that many of those opportunities can be taken advantage of by building well diversified portfolios based on your own unique risk tolerance and time horizon. You don’t need to increase risk in order to achieve your longer term wealth management goals. The name of the game has been to try to garner solid equity-like returns without having to unduly “over-expose” ourselves to the vagaries of stocks. This does not mean you have no allocation towards stocks, but that stocks maybe underweight in the portfolio and in a unique allocation within. Frankly, in the short-run this rally may continue for some time as the volume is low on stock market activity, therefore the bias is to buyers not sellers.
Hopeful But Realistic:
I recently read an article in The Financial Times, “Stocks for the Long Run Still Holds in Spite of the Painful Sell-Off” by famed professor Jeremy Siegel, who wrote that after extreme periods of negative performance, these periods are typically followed by impressive periods of above average returns. Again, I was reminded by the data that defaults on large companies has declined by approx. 1%. The questions still remains, “is this a sustained recovery with reversal coming to the upside or perhaps a pause until we see a more meaningful decline”? With a revenue-less recovery, an unsustainable consumer, little lending, and a questionable small business outlook we think asset preservation should remain the mantra of portfolio management. This does not mean that there are not stocks which are sustainable and pose excellent risk reward benefits. We continue to monitor our stocks and manager of such to seek this value and limit our exposure to certain sectors of the stock market. We continue to believe there are rewards to be had in the fixed income market which serve as preservation of capital while still benefitting with some exposure domestically and internationally to stocks. Additionally, there are equal rewards in the equity markets as well. The key to stocks will be the sustainability to corporate profits. Cost cutting measures within companies wear thin as they can only go so far. The true reality is the average consumer is in the middle of rebuilding their personal balance sheet and is just not spending like before.
Warm thoughts to you and your family this Fall Season.
JJ Burns, CFP
President & CEO
Disclosure: J.J. Burns & Company, LLC is a registered investment adviser with the U.S. Securities & Exchange Commission and maintains notice filings with the States of New York, Florida Pennsylvania, New Jersey, Connecticut, Georgia, Illinois, North Carolina, and California. J.J. Burns & Company, LLC only transacts business in states where it is properly registered, or excluded or exempted from registration. Follow-up and individualized responses to persons that involves either the effecting or attempting to effect transactions in securities, or the rendering of personalized investment advice for compensation, as the case may be, will not be made absent compliance with state investment adviser and investment adviser representative registration requirements, or an applicable exemption or exclusion.
All investing involves risk, including the potential for loss of principal. There is no guarantee that any investment plan or strategy will be successful.
The foregoing content reflects the opinions of J.J. Burns & Company, LLC and is subject to change at any time without notice. Content provided herein is for informational purposes only and should not be used or construed as investment advice or a recommendation regarding the purchase or sale of any security. There is no guarantee that the statements, opinions or forecasts provided herein will prove to be correct.
Past performance may not be indicative of future results. Indices are not available for direct investment. Any investor who attempts to mimic the performance of an index would incur fees and expenses which would reduce returns.
Securities investing involves risk, including the potential for loss of principal. There is no assurance that any investment plan or strategy will be successful.