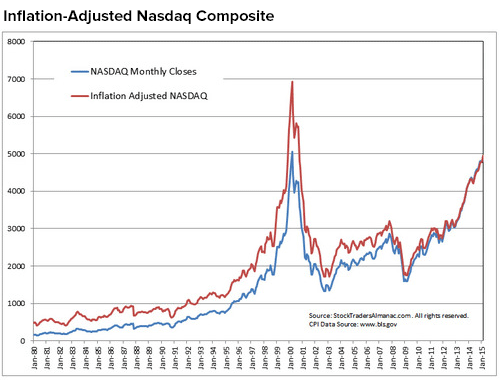
The last time the Nasdaq Composite Index was at 5,000 (in March 2000), global stock prices peaked and subsequently unraveled very rapidly. Just one year after the peak, the Nasdaq was trading 60% lower. By October 2002, the index hit bottom with a nearly 80% loss. It was a spectacular fall. Portfolios suffered around the world and it would take years to rebuild them.
Fast-forward 15 years and here we are again. The Nasdaq is at the 5,000 milestone and investors want to know if we’re at a new market top and if they should sell to protect capital. At JJ Burns & Co., we don’t believe today’s Nasdaq will travel the same road it did in 2000. There are many big differences between 2000 and 2015.
2000 vs. 2015
- In 2000, earnings did not matter. Back then the 20 largest companies in the Nasdaq had an average price/earnings ratio of 395 (trailing 12 mos. earnings). In 2015, the top 20’s average is 108. Remove Amazon and eBay from the equation and 2015’s average drops to 27. Still pricey, but based on some real earnings figures.
- In March 2000, the top 20 stocks earned a collective $26 billion in the trailing 12 months. In March 2015, they earned $167 billion.
- In 2000, the Nasdaq’s average company age was 15 years. In 2015, the average is 25 years.
- Nasdaq 5,000 in 2000 is not the same as 5,000 in 2015. Sure, they’re both at the 5,000 level, but you have to adjust for inflation to make an “apples-to-apples” comparison. When doing so, the Nasdaq would have to be at 7,000 today to be equal to 5,000 in 2000.

- The Nasdaq’s top 10 stocks are different. In 2000, Microsoft was the biggest stock in the Nasdaq, sporting a frothy P/E ratio of 57. In 2015, Apple is the biggest with a significantly more reasonable P/E ratio of 15.

- In 2015, Apple, Cisco, Google and Microsoft have more than $360 billion in cash combined. That’s nearly 25% of all U.S. corporate cash reserves.
The Big Picture
The Nasdaq is a popular, technology-focused index (about 42% is tech). As such, it’s not a good representation of the overall market, due to its lack of industry diversification. That’s why professional money managers and we at JJ Burns & Co. don’t use it as a benchmark for performance comparisons, and why you shouldn’t use it as a buy/sell barometer for your overall portfolio.
This doesn’t mean we should ignore the Nasdaq altogether. The index is pricier than the more widely followed S&P 500, and there are sectors of the Nasdaq that are arguably approaching risky levels. Also, Apple is the largest stock positon in the S&P 500 and the Russell 3000; the social media sector has been on a tear, and biotechs have been a leadership group for a long time.
Nonetheless, we are not worried about the Nasdaq revisiting 5,000. The level today has a different risk profile than it did in 2000, so investors should focus on why they own stocks in their portfolios and stay disciplined with their allocations.


