Welcome to Spring! As with Passover and Easter comes a time for renewal. In this communication we will comment on the recent events and bring you up to date on our views of the markets and economy.

Bear Market Rally?
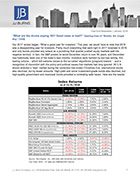
After being at devilishly low levels on the S&P 500 of 666 just a few weeks ago, market averages have rallied to nearly beginning of year values. In the case of the Nasdaq, positive signs are actually flashing up. Certainly, some type of rally was expected as we were at an oversold position. The question was, “how much further did the markets need to decline until we had a relief rally?” Has the world become a better place and the next Bull market is about to begin? Have we simply rallied off such extreme oversold conditions that we are now at a point of equilibrium given the economic Band-Aids which have been applied? Is this the real thing, or just another Bear Market rally?
Here are 3 things to keep in mind:
1) Equity Primer: The playbook is very different in Bear Markets than Bull Markets. In a Bull Market, you buy the dips. Lower prices are an opportunity to buy into equities at cheaper valuations. Most sales are disappointing, as prices eventually go higher. In a Bull Markets, making one purchase (Buy & Hold) is the simplest, most cost effective investment strategy.
Bear markets call for a very different strategy: You take advantage of market rallies to make portfolios smaller in stocks. This is not a perfect strategy as we will make a series of sells inside portfolios which could be lower highs and rallies after sales. If you make buys, most are disappointing, as prices eventually go lower. Buy & Hold is a more difficult strategy in this type of market environment.
Rule of Thumb: The goal during bull markets is to grow your capital; the goal during bear markets is to protect your capital.
2) Beware, Compulsive Optimism: In the run up to the top of the bull market there is an overly positive view of the world, a misconception amongst the broader populace as to what is actually happening. Portfolio rebalancing is eschewed.
Recall these absurd rationales:
- Damage from Subprime mortgages was “contained”
- The US economic slowdown would “decouple” from the rest of the world;
- The conundrum of ultralow interest rates were the result of an “excess savings”
All three of these proved false. And, to the more well-informed advisor/investor, these all contained warnings of the coming investment storm. Through much of these signals we reduced (not eliminated) our stock exposure. Currently, we are hearing similar warnings. Over the past two weeks, four economic data points (ISM data (Institute Supply Management), New Home Sales, Existing Home Sales, and Unemployment) were all spun by Wall Street as if they were positive; if you dug beneath the headlines to review the actual data, they were all terrible.
It is important to understand the difference between an economy that is improving versus one that may be getting worse a bit more slowly.
3) Buying at the perfect bottom is not our goal: This comment often takes investors by surprise – they think they should try to buy at the bottom and sell at the top. The problem with this approach is that we don’t know for sure when it’s the bottom or top until after the fact. Furthermore, guess what? Even if you get the low, you may not make any money.
In 1966, the Dow first hit 1,000. It did not get over 1000 on a permanent basis until 16 years later in 1982. If you managed to catch the exact low in December 1974, well, then, you better have had a strong stomach – the volatility was brutal. That low was followed by a 75% rally, a 27% sell off, a 38% rally and a 24% sell off. But those are nominal numbers. Adjust the returns for inflation, and you actually lost about 75% of your money in real terms (see chart). If you think this sounds ugly, individual sectors making up the same index had even more volatility. On a recent CNBC appearance we discussed the heavy sector bets being made in financials and consumer cyclical companies. Given the uncertainties of a global consumer spending pullback continued job losses, and slower growth the headwinds are still strong.

Our goal is to maximize returns on a risk adjusted basis. This means being more conservative with your investments when risk levels are higher and more aggressive when they are lower. Dollar cost averaging (DCA) into managed funds, broadly asset class diversified and certain index related funds work well. The level of risk in making sector bets is neither required nor prudent given the lack of earnings foresight on a company to company basis. This (DCA) process tends to be efficient and cost effective. For longer portfolio time horizons, we can increase your contributions once the markets fall 30% or so.
It was not too long ago (2003-2007) that mortgage brokers were selling the American dream pretty cheap – which turned into a nightmare for all of us, including our grandkids! Wells Fargo Bank last week posted a big earnings announcement. In fact, some investors are wondering what all the “fuss” was about with these banks anyway? After all, do these banks really need to be stress tested to show if they are solvent? The subprime mortgage problem was once contained to less than $1 trillion. Bill Seidman (former FDIC Chairman) and John Kanas (former CEO Northfork Bank) together indicated to me this problem now stands at maybe $4 trillion. We still don’t have a quantifiable figure! When the mess was over with Bear Stearns in March 2008, “the worst was over”. Then came Fannie and Freddie in the summer of 2008…”the worst was over”… Lehman Brothers…AIG.
In light of the Wells Fargo positive earnings reports, companies like Goldman Sachs and many more banks are piling on the Fargo wagon to raise more capital. Just some perspective here, but what these firms do best is…..Sell! Many times from 2007 through today, banks have “spin doctored” tales in order to raise the funds to remain in business. At each time, it has turned out to be a less than opportune time to purchase stocks. “Compulsive optimism, otherwise known as grasping at straws, is habitual for some economists and CEO’s, especially if they are selling public policy or common stock”
Turning Point Indicators
The Federal Reserve
Make no mistake about it; the Fed is on a full-scale monetization effort. In other words, a “full court-press”. The Fed will be buying or should I say printing money via a combination of issuing agency mortgage backed securities, agency debt and US Treasuries. This process puts money into the system. Including TALF (Term Asset Backed Lending Facility) this Herculean effort of bringing back liquidity to the markets will be around $ 4 Trillion! Clearly, this is unparalleled in Economic History. $4 Trillion is approx. 33% of Gross Domestic Product (GDP). This coupled with the easing of interest rates has helped to bring down mortgage rates. In previous communications we indicated this would be a direct result of liquidity coming back to the credit markets as engineered by The Fed. This easing makes the depression era of 1934 pale in comparison. The Fed clearly wants banks to lend money. We have already seen a re-flation of sensitive sectors (financials and consumer discretionary stocks). However, stimulus comes at a high cost, and cannot last indefinitely.
Leading Economic Indicators
The Index of Leading Economic Indicators (the yield curve, real money growth and jobless claims are all components of the leading index) should turn before Coincident Economic Indicators (COI) turn. Coincident indicators, those indicators that move with the business cycle, continued to fall at an accelerating pace though February. Lately, these indicators have slowed a bit… but as indicated above are still falling at a slower pace. The LEI Index is still declining as well, but at a slower pace. The graph below depicts both.

The key to identifying turning points, however, is to focus on leading indicators (as opposed to lagging or coincident indicators like loan growth and the unemployment rate). I have mentioned before that job losses (unemployment rates) are lagging indicators. It’s important to note though that we live in a primarily consumer driven economy. More than 70% of our GDP is derived from consumer activity.
Technical Perspectives
Away from the fundamentals above, I thought it would be important to share technical charts with you as well. In some of our conversations with clients these points have arisen. Furthermore, many technical charts are shared and spoken about in the media.

The previous chart is the current market. The circled areas indicate the bottoms at that time we have gone down to.
November 2008: approx. 750 S&P 500 and then early March intraday trading we saw the S&P go 666.
It usually takes a year to form a bottom after catastrophic events such as the banking problems, however, we are in unusual times.

This second chart above depicts the 2001-2002 time period. Again the circled areas indicate the 3 bottoms which occurred. Interestingly the second decreases more than the first, then ultimately the third test begins a period of higher highs.
The third and final chart in this series above shows 1981-1982 stock market bottom. Here again, after two tests, the market formed a bottom which took more than a one year period. From this technical perspective its likely we will test the 750 bottom made previously and begin forming a “higher than the previous low base”.

Where Do Bonds Come In?
Two of the best leading indicators of general credit trends are the Treasury spread and interest-rate swap spreads. When credit markets are improving in an uneven and halting fashion as they are now, it becomes crucial to identify leading indicators of the creditcycle. That way, we can have confidence in the underlying direction of credit markets. On this score, there is a long history of the yield curve leading credit spreads (the Treasury spread (difference between 10 year Treasury note and corporate bonds) tends to lead credit spreads by about 18 months – see graph where interest rates are pushed 18 months forward). Interest-rate swap spreads (difference between fixed and variable interest rates) also have powerful leading indicator properties, although there only is a 20-year history with this indicator (the two-year swap spread tends to lead high yield spreads by 12 months). There was a shorter-than-usual, but still prevalent, lag between interest rate swap spreads and other credit spreads moving into the 2007-2008 credit cycle. In any event, with short term and long term interest rates widened and interest-rate swap spreads in the mid-50s (from 165 in early October), we are more confident that corporate credit market spreads may be significantly narrower next year at this time. In other words, as the crisis in the credit markets dissipate, yields on bonds, especially on Corporate and High yielding bonds may come down and ultimately leaving the bond holder with potentially better returns. TIPS (Treasury Inflation Protection Securities) act as some level of protection so if inflation should arise these securities are designed to increase in value as the inflation rate increases. This three-teared approach helps to add another level of asset allocation to the portfolio. Today inflation is not an issue, but likely a good value in today’s markets. These bonds are backed by the US Government. One of the primary goals of the Federal Reserve easing of interest rates, is to restore liquidity to credit markets. At some point things will improve. The credit markets continue to show glimmers of improvement.

We are optimistic, that stabilization will eventually occur and lead us to a period of “normalcy”. Certainly, stabilization is better than a free fall, however, stabilization is not recovery. A return to positive output growth without job growth would be cause for relief, perhaps, but not celebration. There will be unintended consequences along the way, as we have seen already. We are at the beginning of fixing our problems. For many of the reasons stated above, asset allocation is key in determining the success of a portfolio. Re-regulation of the financial industry, decreased consumer credit (higher credit card financing) and far less bank lending are longer term issues which need to be worked through the system to get to stabilization. Finally, consumer spending habits have changed as job losses mount. Economic recovery is likely to be slow and protracted. Increased consumer savings is healthy for the long run, but stagnates recovery as it hurts consumer behaviors in the short run. The real test of Americas resolve is yet to come.
As was indicated in our fourth quarter newsletter, we maintain broad asset class diversification with a lower allocation towards stocks as value in the markets rests with an improving credit market and higher yielding bonds. If yields in these areas continue to narrow the bond holder will enjoy competitive interest rate returns (income) along with the potential for capital appreciation as bond prices likely pull closer to par levels.
As always if you have any questions or wish to simply share your thoughts with us, please don’t hesitate to call.
Sincerely,
JJ Burns, CFP
President & CEO
Sources:
Federal Reserve Board
Bloomberg
MKM Partners: Turning Point Indicators, Mike Darda
NY Times: Room for Debate, April 6, 2009
Big Picture: Bear Rally, Technical indicators
Roger Altman: Fmr. deputy Treasury secretary, Clinton Admin
James K. Galbraith, Professor University Texas
Bill Seidman: Former FDIC President
John Kanas: Former CEO Northfork Bank
The ChartStore: technical charts January,March, April 2009
Soleil Securities: Perspectives April 2009
Disclosure: J.J. Burns & Company, LLC is a registered investment adviser with the U.S. Securities & Exchange Commission and maintains notice filings with the States of New York, Florida Pennsylvania, New Jersey, Connecticut, Georgia, Illinois, North Carolina, and California. J.J. Burns & Company, LLC only transacts business in states where it is properly registered, or excluded or exempted from registration. Follow-up and individualized responses to persons that involves either the effecting or attempting to effect transactions in securities, or the rendering of personalized investment advice for compensation, as the case may be, will not be made absent compliance with state investment adviser and investment adviser representative registration requirements, or an applicable exemption or exclusion.
All investing involves risk, including the potential for loss of principal. There is no guarantee that any investment plan or strategy will be successful.
The foregoing content reflects the opinions of J.J. Burns & Company, LLC and is subject to change at any time without notice. Content provided herein is for informational purposes only and should not be used or construed as investment advice or a recommendation regarding the purchase or sale of any security. There is no guarantee that the statements, opinions or forecasts provided herein will prove to be correct.
Past performance may not be indicative of future results. Indices are not available for direct investment. Any investor who attempts to mimic the performance of an index would incur fees and expenses which would reduce returns.
Securities investing involves risk, including the potential for loss of principal. There is no assurance that any investment plan or strategy will be successful.